
Athlete Deaths are 1700% higher than expected since COVID Vaccine roll-out
And it will only get worse...
by THE EXPOSÉ
An investigation of official statistics has found that the number of athletes who have died since the beginning of 2021 has risen exponentially compared to the yearly number of deaths of athletes officially recorded between 1966 and 2004.
So much so that the monthly average number of deaths between January 2021 and April 2022 is 1,700% higher than the monthly average between 1966 and 2004, and the current trend for 2022 so far shows this could increase to 4,120% if the increased number of deaths continues, with the number of deaths in March 2022 alone 3 times higher than the previous annual average.
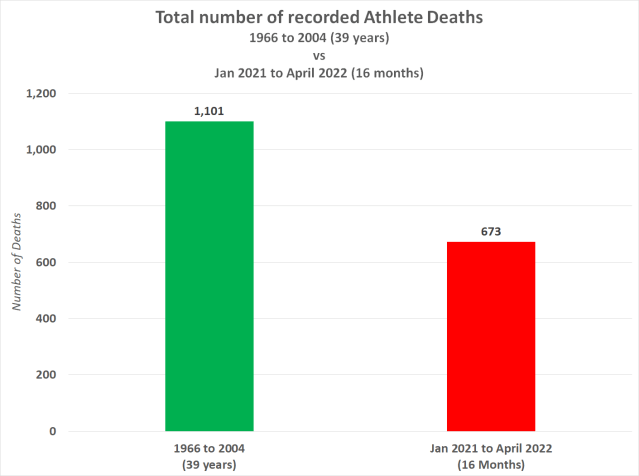
According to a scientific study conducted by the ‘Division of Pediatric Cardiology, University Hospital of Lausanne, Lausanne, Switzerland which was published in 2006, between the years 1966 and 2004 there were 1,101 sudden deaths among athletes under the age of 35.
Now, thanks to the GoodSciencing.com team, we have a comprehensive list of athletes who have collapsed and/or died since January 2021, a month after the first Covid-19 injection was administered to the general public.
Because it is such as long list we are not including it in this article so that full list can be accessed in full here.
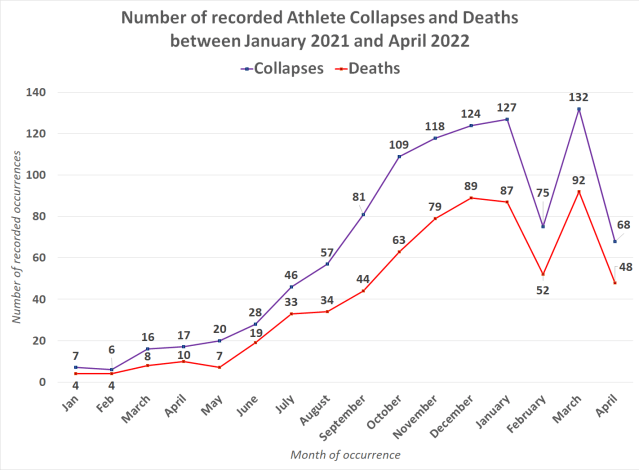
The following chart shows the number of recorded athlete collapses and deaths between January 2021 and April 2022, courtesy of the linked list above –
As you can see there has undoubtedly been a rise from January 2021 onwards, the question is whether this was ordinary and to be expected.
In all between Jan 21 and April 22 a total number of 673 athletes are known to have died. This number could, however, be much higher. So that’s 428 less than the number to have died between 1966 and 2004. The difference here though is that the 1,101 deaths occurred over 39 years, whereas 673 recent deaths have occurred over 16 months.
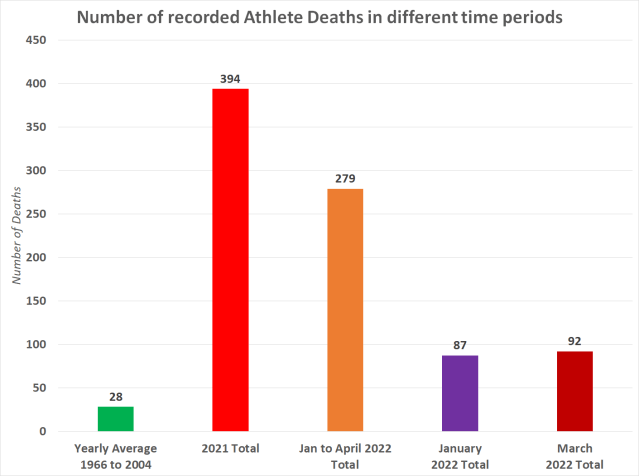
The following chart shows the number of recorded athlete deaths in different time periods –
The yearly average number of deaths between 1966 and 2004 equates to 28. January 2022 saw 3 times as many athlete deaths as this previous annual average, as did March 2022. So this is obviously highly indicative of a problem.
The 2021 total equates to 394 deaths, 14x higher than the 1966 to 2004 annual average. The Jan to April 2022 total, a period of 4 months, equates to 279 deaths, 9.96x higher than the annual average between 1966 and 2004.
However, if we divide the 66 to 04 annual average by 3 to make it equivalent to the 4 months’ worth of deaths so far in 2022, we get 9.3 deaths. So in effect, 2022 so far has seen deaths 10x higher than the expected rate.
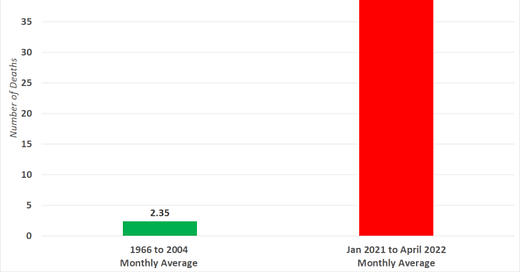
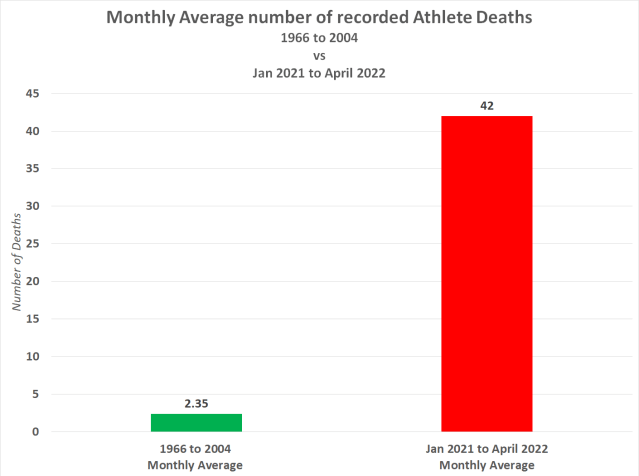
The following chart shows the monthly average number of recorded athlete deaths –
So between 1966 and 2004. the monthly average number of deaths equates to 2.35. But between January 2021 and April 2022, the monthly average equates to 42. This is an increase of 1,696%.
So why have we seen such a dramatic increase?
The answer most likely lies in the introduction of an experimental injection that was alleged to protect against Covid-19 disease but instead caused untold damage to the immune system and cardiovascular problems.
A study of 566 patients who received either the Pfizer or Moderna vaccines shows that signs of cardiovascular damage soared following the 2nd shot. The risk of heart attacks or other severe coronary problems more than doubled months after the vaccines were administered, based on changes in markers of inflammation and cell damage.
Patients had a 1 in 4 risk for severe problems after the vaccines, compared to 1 in 9 before. Their 5-year heart attack risk went from 11% to 25% thanks to the vaccines (that is a 227% increase).
Dr. Steven Gundry, a Nebraska physician and retired cardiac surgeon, presented the findings at the Scientific Sessions of the American Heart Association’s annual conference in Boston On November 12-14. An abstract of his paper was published on November 8 in Circulation, the AHA’s scientific journal.
https://www.opindia.com/2021/11/mrna-covid-19-vaccines-increase-possibility-of-coronary-diseases-study/amp/
https://www.ahajournals.org/doi/abs/10.1161/circ.144.suppl_1.10712?s=09
But we really don’t need to look any further than the number of cases of myocarditis caused by Covid-19 vaccination. Myocarditis is a condition that causes inflammation of the heart muscle and reduces the heart’s ability to pump blood, and can cause rapid or abnormal heart rhythms.
Eventually, myocarditis weakens the heart so that the rest of the body doesn’t get enough blood. Clots can then form in the heart, leading to a stroke or heart attack. Other complications of the condition include sudden cardiac death. There is no mild version of myocarditis, it is extremely serious due to the fact that the heart muscle is incapable of regenerating. Therefore, one the damage is done there is no rewinding the clock.
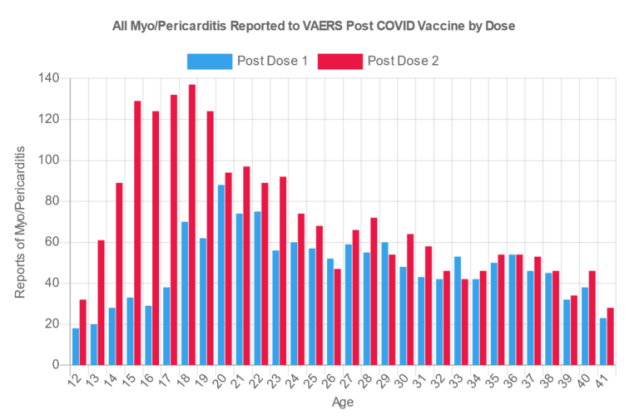
The following chart shows reports of myocarditis to the U.S. Centers for Disease Control’s Vaccine Adverse Event Reporting System by year –
Heart damage is ubiquitous throughout the vaccinated population, and the damage is being diagnosed in multiple ways. Acute cardiac failure rates are now 475 times the normal baseline rate in VAERS. Tachycardia rates are 7,973 times the baseline rate. Acute myocardial infarction is 412 times the baseline rate. The rates of internal haemorrhage, peripheral artery thrombosis, coronary artery occlusion are all over 300 times the baseline rate.
Fully vaccinated people are suffering like never before.
It doesn’t take a genius to work out that Covid-19 vaccination is the reason the monthly average number of athlete deaths is now 1,700% higher than the expected rate.
They want you dead.
Do NOT comply.






Damn !!!! And we have never seen the like of this before. You’d think ESPN Sports illustrated or anyone involved in sports
Would …..ohhh yeah espn is owned by Disney who is owned by ? Some other
Mega globocom to n on the genocide
Never mind.,
My own brother a sports fan will not
Even admit to this crime.
I’d send him this info but his message
Would be I am not participating in your
Tin hat 🎩 conspiracy..
And I’d say whether or not you want to
You are in the damn game.
Whilst I appreciate what the Expose is doing, I always feel that they can be a bit overly dramatic with their data reports.
One thing that always concerns me, whoever presents data and graphs, is when the dates appear to be cherry picked.
I.E Starting or finishing on an odd date, or not being consecutive.
Why choose 2004 as the cut off date for the monthly averages?
Why not April 2019 or 2020?