


Discover more from 2nd Smartest Guy in the World
Exposing Psyops & Scams
Over 36,000 subscribers
Already have an account? Sign in
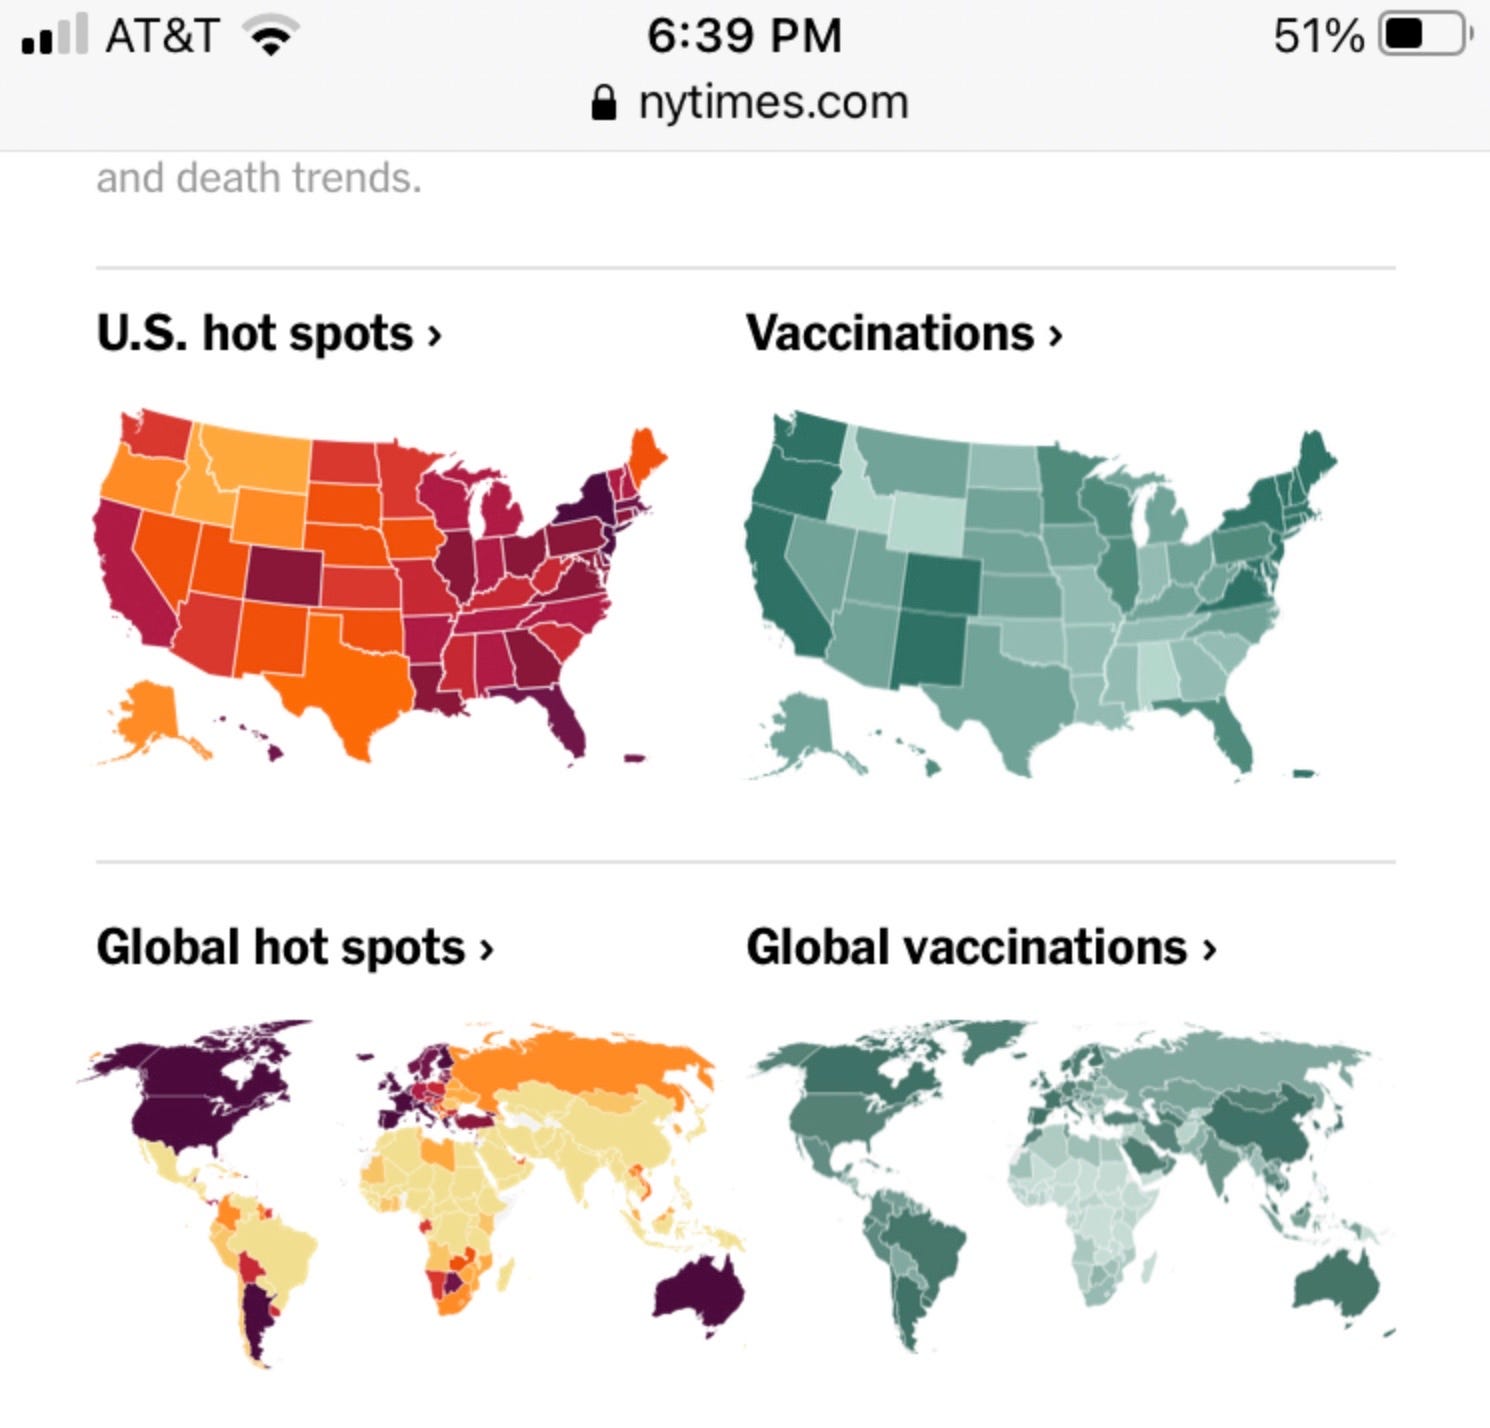
"Weird chart. Looking at it one would almost think that new Covid cases are perfectly correlated with (mRNA) Covid vaccination levels at both the state and national level:"

Subscribe to 2nd Smartest Guy in the World
Thousands of paid subscribers
Exposing Psyops & Scams


In fact, if that chart is even remotely truly representing reality, then statisticians must draw the twin conclusions that either: 1) vaxxination and incidence of infection are correlated (except China), or 2) that the methods of "counting" "cases" and "incidence" varies from location to location and is inconsistent. Assuming China not to be an exception - then clearly #2 is correct.
There is 3rd possibility - and that is Genevieve Briand's hypothesis - https://web.archive.org/web/20201126171926/https://www.jhunewsletter.com/article/2020/11/a-closer-look-at-u-s-deaths-due-to-covid-19 meaning we have a normal endemic 22 months.